
European Radiology:鉴别肿块型慢性胰腺炎与胰腺癌的放射组学列线图
2022-08-13 shaosai MedSci原创

目前,放射组学可以将成像数据转化为高维特征空间,并利用该空间预测PDAC的肿瘤分期、分级、治疗效果和预后。
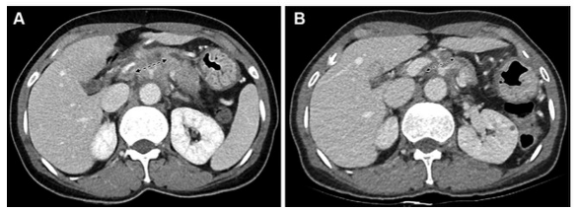
慢性胰腺炎(CP)定义为长期的胰腺炎症导致外分泌实质不可逆转的损害和纤维化。CP在形态上的特点是大量的纤维化取代了被破坏的实质,导致胰腺萎缩。然而,CP有时也可能导致胰腺肿大。如果这种肿大表现为局灶性,则称为肿块形成型CP(MFCP),与胰腺导管腺癌(PDAC)鉴别困难。
此外,与正常胰腺患者相比,CP患者患胰腺癌的风险明显增加。PDAC和MFCP的临床表现、危险因素、影像学特征和实验室结果都有重叠,因此这两个实体之间的区分往往具有挑战性。延迟诊断可能会导致早期PDAC的进展,并可能迅速变得无法切除,而将MFCP误诊为PDAC可能导致不必要的手术。
目前,放射组学可以将成像数据转化为高维特征空间,并利用该空间预测PDAC的肿瘤分期、分级、治疗效果和预后。然而,很少有放射组学研究评估MFCP和PDAC之间的鉴别诊断。
近日,发表在European Radiology杂志开发并验证了一个CT列线图和基于CT的放射组学特征以区分CP患者的MFCP和PDAC,并期评估了应用于常规多排CT时的价值。

本项研究对本机构内治疗的138名经组织病理学诊断的MFCP或PDAC患者的数据进行了回顾性分析。由两位放射科医生根据预定的标准分析了原始的CT图像。使用图像分割、特征提取、特征还原和选择创建放射组学模型。CT和放射组学模型是利用103名连续患者的训练队列的数据建立的。这些模型在35名连续患者中得到了验证。通过多变量逻辑回归分析,建立了MFCP和PDAC的鉴别诊断模型,并以列线图的形式显示。根据其鉴别能力和临床实用性,确定了列线图的性能。
患者的平均年龄为53.7岁,75.4%为男性。CT列线图在训练(曲线下面积[AUC],0.87)和验证(AUC,0.94)队列中显示出对两种病变的良好区分。放射学列线图在训练(AUC,0.91)和验证(AUC,0.93)队列中显示出良好的区分性。决策曲线分析显示,如果阈值概率分别为0.05-0.85和>0.05,患者可以从CT和放射组学列线图中获益。

图 CT和放射学模型的决策曲线分析。红线代表CT模型,绿线代表放射组学模型,黑线代表假设所有患者都有肿块形成的慢性胰腺炎(MFCP),灰色线代表所有假设患者都有胰腺导管腺癌(PDAC),X轴代表阈值概率。验证队列中的决策曲线表明,如果CT和放射组学模型的阈值概率分别为0.05-0.85和>0.05,使用列线图预测MFCP和PDAC比 "将所有患者作为MFCP治疗 "方案或 "将所有患者作为PDAC治疗 "方案更有利
本研究开发并验证了一个CT和一个基于CT的放射组学模型,两者在区分CP患者的MFCP和PDAC方面都表现得相当准确,在完善这类患者的胰腺肿块管理方面具有很大的临床潜力。
原文出处:
Hao Zhang,Yinghao Meng,Qi Li,et al.Two nomograms for differentiating mass-forming chronic pancreatitis from pancreatic ductal adenocarcinoma in patients with chronic pancreatitis.DOI:10.1007/s00330-022-08698-3
本网站所有内容来源注明为“梅斯医学”或“MedSci原创”的文字、图片和音视频资料,版权均属于梅斯医学所有。非经授权,任何媒体、网站或个人不得转载,授权转载时须注明来源为“梅斯医学”。其它来源的文章系转载文章,或“梅斯号”自媒体发布的文章,仅系出于传递更多信息之目的,本站仅负责审核内容合规,其内容不代表本站立场,本站不负责内容的准确性和版权。如果存在侵权、或不希望被转载的媒体或个人可与我们联系,我们将立即进行删除处理。
在此留言


#列线图#
74
#PE#
65
#肿块#
71
好文章,谢谢分享。
88