SPSS软件应用:两指标间的关系分析
2015-04-24 MedSci MedSci原创

两个变量之间存在一次方函数关系,就称它们之间存在线性关系。临床医学统计中有三种主要的线性关系:线性相关(Pearson相关)、秩相关(Spearman相关)和曲线相关(曲线拟合)。本文结合临床实际案例讲述如何使用SPSS软件分析两指标间的关系。一、线性相关线性相关是最常见的相关分析,也叫做Pearson相关分析。定性资料相关:当一个变量增大,另一个变量也随之增大,称为共变或相关。两个变量有共变现象
两个变量之间存在一次方函数关系,就称它们之间存在线性关系。临床医学统计中有三种主要的线性关系:线性相关(Pearson相关)、秩相关(Spearman相关)和曲线相关(曲线拟合)。本文结合临床实际案例讲述如何使用SPSS软件分析两指标间的关系。
一、线性相关
线性相关是最常见的相关分析,也叫做Pearson相关分析。定性资料相关:当一个变量增大,另一个变量也随之增大,称为共变或相关。两个变量有共变现象即称有相关关系。反映两定量指标间呈线性关系趋势的关系称为线性相关,又称简单相关,统计学指标为Pearson相关系数。
两变量间的线性关系密切程度与相关方向用直线相关系数r表示(-1≤ r ≤ 1)。r>0为正相关,r<0为负相关,r=0为零相关或无相关,|r|=1为完全相关,|r|越大说明相关程度越密切。
案例:
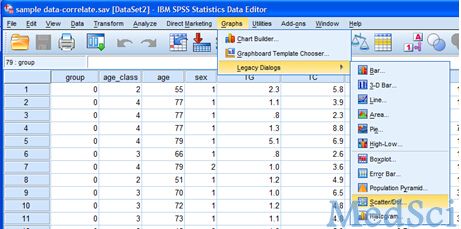
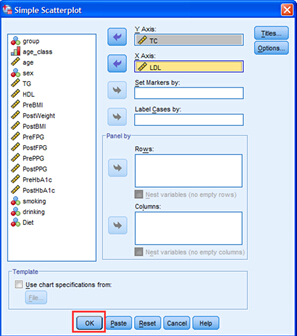
求总胆固醇(TC)与低密度脂蛋白(LDL)间的相关性。(数据可到MedSci临床研究学院下载)
分析思路:散点图 » 计算相关系数 » 相关系数的假设检验。
SPSS操作
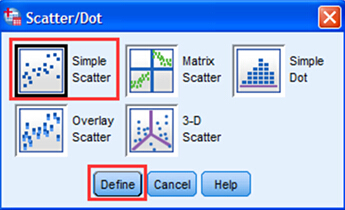
1.散点图
结果
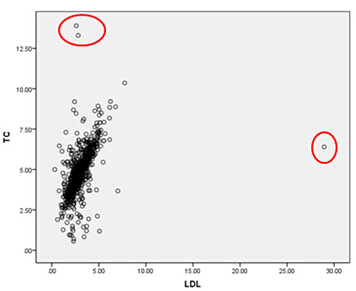
注:检查有无异常点,谨慎剔除。
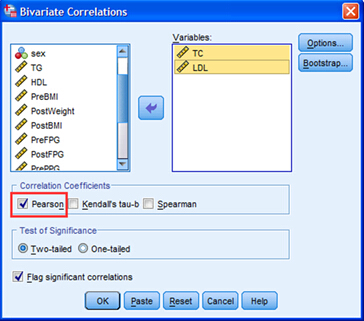
2.相关分析
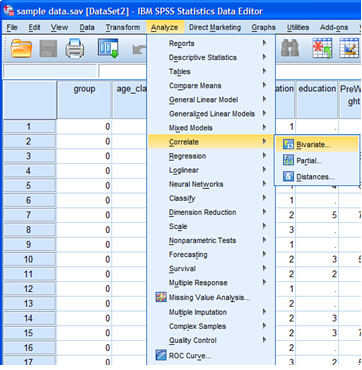
SPSS相关分析模块
Bivariate(双变量):用于进行两个/多个变量间的参数/非参数相关分析。如果是多个变量,则给出两两相关的分析结果。最常用——线性相关、秩相关。
Partial(偏相关):如果需要进行相关分析的两个变量,其取值受到其他变量的影响,则偏相关分析可以对其他变量进行控制,输出控制其他变量后的相关系数。
Distance(距离):该过程一般不单独用,作为因子分析、聚类分析和多维尺度分析的预分析过程。
相关分析SPSS » Analyze » correlate » bivariate correlation
结果

计算相关系数:Pearson相关系数r=0.491>0,说明正相关。相关系数的假设检验:P<0.001,说明该r具有统计学意义。
注意事项:
1、进行线性相关分析前,必须先做散点图,以初步判断两变量之间是否存在相关趋势?该趋势是否为线性趋势?以及数据中是否存在异常点?
2、相关分析不一定是因果关系!
例如:某夫妇生儿种树,儿长树高,相关关系有统计学意义,但非因果关系。
二、秩相关
秩相关也叫等级相关或Spearman秩相关,适用于非正态/总体分布未知/分类等级资料的相关分析。秩相关分析对原变量的分布不作要求,属非参数统计方法;最常用的统计量为Spearman秩相关系数,又称等级相关系数。
Spearman等级相关分析步骤:将各变量X,Y分别编秩RX, RY;计算RX与RY的Pearson相关;所得结果即为Spearman等级相关rS(-1≤rs≤1)。
案例
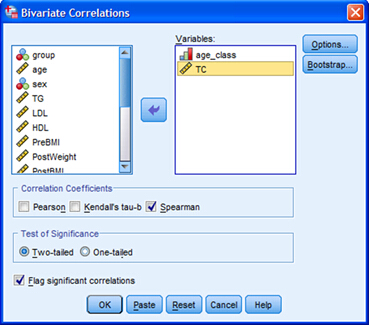
求总胆固醇(TC)与年龄等级间的相关性。其中,年龄等级划分如下:<45=1;45~60=2;61~75=3;>75=4。
SPSS软件操作
Analyze » correlate » bivariate correlation
Kendall 与Spearman比较:两者均对数据进行排序。但Spearman是以复合样本整体进行排序,而Kendall‘s是以每个样本单独进行排序,考察其方向的一致性。Spearman比较常用!
结果
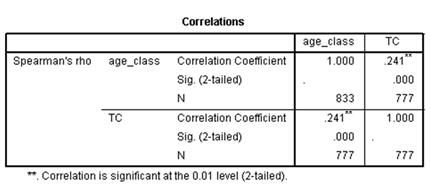
Spearman相关系数为-0.017,给出两个信息!P<0.001,说明相关系数具有统计学意义。
相关系数绝对值越大,相关性越强;呈正相关,年龄等级越大,TC越高。
注意事项:对于相同的数据,Spearman相关系数和Kendall‘s相关系数的绝对值均小于Pearson相关系数,显然是由于秩变换或者数据有序分类处理时损失信息所导致的。Spearman相关系数的计算公式可以完全套用Pearson相关系数的计算公式,但公式中的X和Y用对应的秩次代替即可。
三、曲线相关
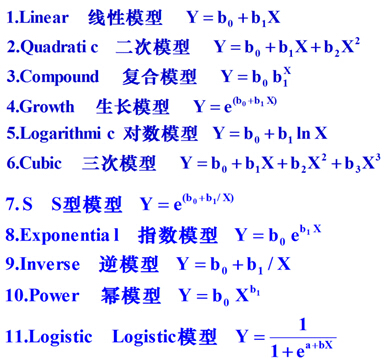
曲线相关,也就是曲线拟合,当两变量关系不呈线性变化且有曲线趋势时,如何选择相应的曲线模型。一般步骤:①依据分析目的确定X与Y,根据两变量散点图、结合专业知识选择曲线类型;②求回归方程:曲线直线化;③拟合优度:R2,反应两变量曲线关系的密切程度。
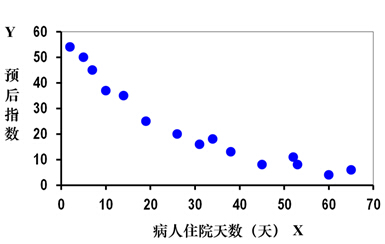
案例
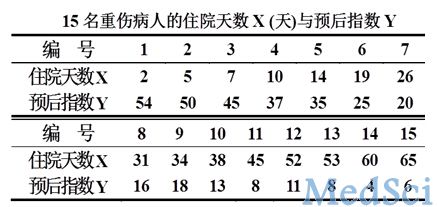
1.数据散点图
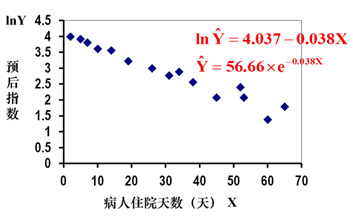
对Y作对数变换后的散点图
SPSS操作
Analyze » Regression » Curve Estimation


SPSS中曲线模型
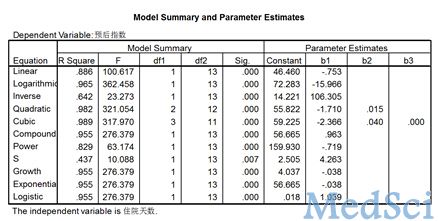
案例分析结果

本文结合临床实际案例讲解SPSS软件中如何对两指标间做线性关系分析,根据实际情况选择合适的线性关系分析方法。文中涉及的案例数据可以到MedSci临床研究学院edu.medsic.cn下载。更多课程免费试听学习!同时您也可以下载MedSci医学App随时在线学习。MedSci
小提示:本篇资讯需要登录阅读,点击跳转登录
版权声明:
本网站所有内容来源注明为“梅斯医学”或“MedSci原创”的文字、图片和音视频资料,版权均属于梅斯医学所有。非经授权,任何媒体、网站或个人不得转载,授权转载时须注明来源为“梅斯医学”。其它来源的文章系转载文章,或“梅斯号”自媒体发布的文章,仅系出于传递更多信息之目的,本站仅负责审核内容合规,其内容不代表本站立场,本站不负责内容的准确性和版权。如果存在侵权、或不希望被转载的媒体或个人可与我们联系,我们将立即进行删除处理。
在此留言
本网站所有内容来源注明为“梅斯医学”或“MedSci原创”的文字、图片和音视频资料,版权均属于梅斯医学所有。非经授权,任何媒体、网站或个人不得转载,授权转载时须注明来源为“梅斯医学”。其它来源的文章系转载文章,或“梅斯号”自媒体发布的文章,仅系出于传递更多信息之目的,本站仅负责审核内容合规,其内容不代表本站立场,本站不负责内容的准确性和版权。如果存在侵权、或不希望被转载的媒体或个人可与我们联系,我们将立即进行删除处理。
在此留言


hao
161
有用
147
有用
162
回去再细细研究,必须拿下。
163
非常实用重新学习了
225
学习了,不过对于我的课题中具体使用怎么样的相关统计还有有些不明白
175
学习呢
118